
Table of Contents
A real-time escalation dashboard is a live command center. It tracks, prioritizes, and drives action on critical incidents before response times or SLAs are breached. In today’s operations, this often means reacting within 15 minutes using platforms.
For us, it’s not a passive report, it’s an execution layer. When alerts flood in from infrastructure, security, and customer channels, this single view shows what’s escalating, why it matters, and who owns the fix. Let’s look at how these dashboards work, who uses them, what data they need, and how to build them to handle scale without drowning in noise.
Key Takeaways
- We use real-time escalation dashboards to surface high-severity incidents before SLA breaches occur.
- The most effective dashboards combine live data, strict prioritization, and clear escalation ownership.
- Poor normalization and alert overload are the main reasons escalation dashboards fail at scale.
What Is a Real-Time Escalation Dashboard?
A real-time escalation dashboard is a live command center. It shows your team every critical incident, its priority, and its exact escalation status in one place.
This dashboard acts as a single source of truth. It pulls live data from your monitoring tools, ticketing systems, and security platforms, combining them into one clear status board. As noted by IBM, these platforms provide a:
“unified dashboard and real-time insight into security and compliance risks across people, data, applications and infrastructure. This allows organizations to move from reactive to proactive management by identifying signals before they escalate into full-blown crises.” – IBM Security / FBIIC [1]
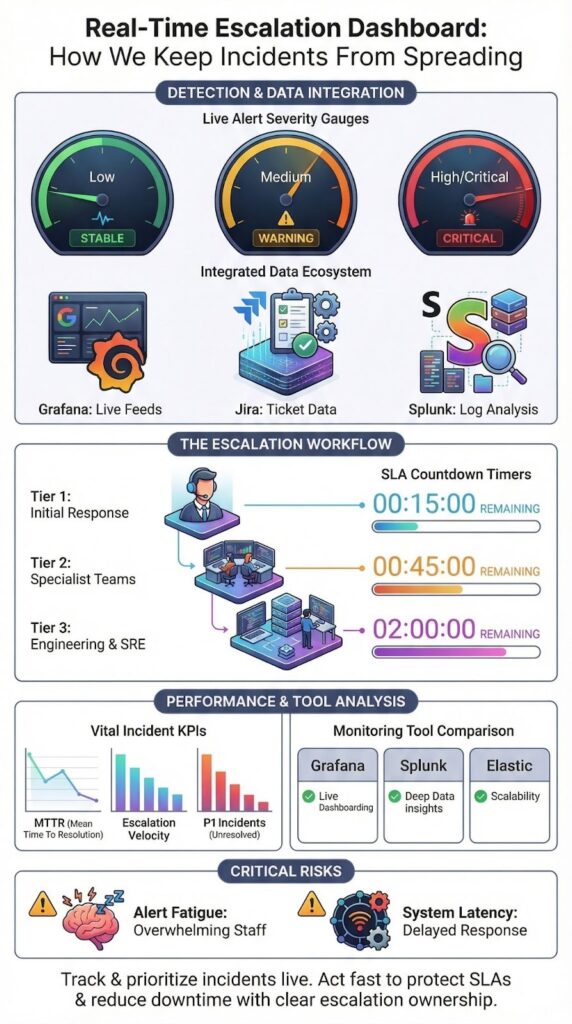
A functional dashboard typically includes a few core elements:
- Live Alert Visualization. A clear view of all active alerts, organized by severity and user impact.
- Workflow Display. A map showing where each incident is in the escalation process, from Tier 1 to Tier 3.
- Real-time SLA Monitor. A countdown or timer showing how much time is left to meet response targets for each open issue.
With these components, teams can move directly from seeing a problem to fixing it, without wasting time switching between apps or waiting for a report.
Which Teams Use Real-Time Escalation Dashboards and Why?

Three main teams rely on real-time escalation dashboards to cut through noise and act fast: IT operations, security teams, and customer support.
For IT and Security Operations Centers (SOCs), the dashboard is a live control panel. It ensures that technical issues do not stagnate. According to the NIST, such solutions provide:
“real-time incident monitoring and detection, privilege escalation management, and reporting functions. By visualizing the diverse types of devices connected to the network and enforcing policy-based controls, the system ensures that strategic decisions are maintained while preventing serious problems from languishing.” – National Institute of Standards and Technology [2]
The main goal is simple: spot problems early and escalate them before they cause a major outage.
- Tracks infrastructure and service health alerts.
- Escalates unresolved incidents to prevent outages.
- Monitors system dependencies in real time.
In a SOC, this dashboard is a critical triage surface. With large SOCs often facing thousands of alerts daily, using the dashboard to prioritize what matters most isn’t just helpful, it’s essential for an effective response.
For support teams, the focus shifts from raw alerts to customer impact. Their dashboard tracks escalating support tickets, customer complaints, and looming SLA breaches.
What Data Sources Power a Real-Time Escalation Dashboard?

A real-time escalation dashboard gets its power from live data streams. It pulls information from the tools your teams already use, combining them to show urgent issues the moment they happen.
This consolidation is critical during active crisis management, where fragmented signals slow response and increase impact. The dashboard typically aggregates three primary types of data.
Monitoring systems provide the first stream: raw alerts about infrastructure or application health. Ticketing platforms provide the second: the current status, owner, and lifecycle of each incident. Security tools, including SIEM and SOAR platforms, contribute the third stream: threat context and severity scoring for security events.
This queue shows not just technical alerts, but also their operational progress, who’s working on it and what’s been done.
The essential data inputs are:
- Alert Feeds: Live notifications from infrastructure, application, and network monitoring tools.
- Ticket Lifecycle Data: Updates on acknowledgment, assignment, and handoff status from your ticketing system.
- Security Telemetry: Threat alerts and context from Security Information and Event Management (SIEM) and Security Orchestration, Automation, and Response (SOAR) platforms.
The critical step is establishing clean “data contracts” between these systems. Without standardized formats and reliable connections, the dashboard’s metrics become misleading, showing an inaccurate picture of what’s truly urgent.
Which KPIs Matter Most in Escalation Monitoring?
The most important KPIs for an escalation dashboard are the ones that measure speed and impact, not just activity. They should tell you if your process is working under pressure. These metrics validate whether your escalation workflow is actually moving incidents forward instead of letting them stall between tiers. The goal is to track momentum, not volume.
Mean Time to Resolve measures how long it takes to actually fix it. Data from monitoring leaders indicates teams that actively watch MTTR can reduce downtime costs by up to 40% by catching and escalating problems earlier.
Other essential indicators include:
- Escalation Velocity: How quickly an incident moves from one support tier to the next.
- SLA Breach Count: The number of times you’ve missed a critical response or resolution deadline.
- Open P1 Incidents: The real-time count of your most severe, unresolved problems.
These KPIs help you make proactive adjustments, like changing alert thresholds or reallocating staff, before small backlogs turn into major failures.
The guiding principle is to avoid “vanity metrics.” If a number on your dashboard doesn’t directly influence your team’s decisions or actions in the moment, it’s just taking up space. Every metric should have the power to change behavior.
How Do Popular Tools Compare for Building Escalation Dashboards?
The right tool for your escalation dashboard depends on your team’s needs: open-source for flexibility, enterprise platforms for reliability. Tool choice also affects how well teams can execute a crisis escalation workflow under pressure, especially when multiple incidents compete for attention. Your choice impacts how fast and useful the dashboard really is.
Here’s a quick look at three common options:
- Grafana is highly customizable and free, great for ops teams. But it can get slow with very complex, large-scale queries.
- Splunk is a powerful, enterprise-grade analytics platform. It’s very reliable but comes with a high price tag, suited for larger companies.
- Elastic (ELK Stack) is built for fast log searching, ideal for security teams. The downside is its complexity to set up and maintain properly.
You can get lightning-fast queries, but only if your logs are clean and well-structured from the start.
Below is a simplified comparison we often reference when evaluating escalation monitoring tools.
| Tool | Strengths | Limitations | Best Fit |
| Grafana | High customization, open source | Query lag at scale | Ops teams |
| Splunk | Enterprise grade analytics | High cost | Large organizations |
| Elastic | Fast log search | Setup complexity | Security operations |
No tool fixes poor escalation design. The dashboard only reflects the quality of the underlying workflows.
What Are Common Failure Points in High-Volume Environments?
Credits : Zscaler Inc.
In high-volume environments like large Security Operations Centers (SOCs), escalation dashboards often break down at a few predictable points. The most common failure is data latency.
If the status on your dashboard is even a few minutes behind reality, your team will stop trusting it. This usually happens because the underlying systems are updating in batches instead of streaming data in real time.
Alert fatigue is the next major failure. When thousands of alerts pour in without strict filtering and prioritization, the dashboard becomes a wall of noise. As research on cognitive load shows, this overload directly harms the quality and speed of decisions during a crisis.
Other frequent problems include:
- Unclear Ownership: Incidents appear on the board with no clear assignee, so they get discussed but never acted upon.
- Inconsistent Severity: The same type of issue might be scored as “Critical” by one system and “Low” by another, making prioritization impossible.
These failures transform what should be an active command center into a passive, confusing display. In high-volume settings, the only way to keep a dashboard useful is through disciplined escalation analytics.
FAQ
What does a real-time escalation dashboard show during active incidents?
A real-time escalation dashboard shows the live status of incidents as they move through escalation stages. It displays active alerts, current severity levels, assigned responders, and escalation progress in one view. With live alert visualization and an escalation workflow display, teams can immediately see which incidents require action and which are already being handled.
How does a real-time escalation dashboard help prioritize critical alerts?
A real-time escalation dashboard helps prioritize alerts by ranking incidents based on severity, impact, and response urgency. An alert prioritization board highlights high-risk issues using escalation severity indicators and alert escalation timelines. This structure ensures teams focus first on incidents that threaten operations, security, or compliance.
Can a real-time escalation dashboard support security operations teams?
A real-time escalation dashboard supports security operations by centralizing incident visibility and response tracking.
It functions as a security operations dashboard where teams monitor threats, review escalation status, and coordinate actions. With SOC realtime triage and a cybersecurity incident tracker, security teams respond faster and reduce confusion during active incidents.
How does real-time escalation tracking improve response performance?
Real-time escalation tracking improves response performance by exposing delays, bottlenecks, and recurring issues. Escalation performance metrics, escalation velocity charts, and incident escalation analytics show how quickly incidents move through each stage. This data helps teams refine workflows, improve response times, and meet real-time SLA monitoring goals.
Why is visualization important in a real-time escalation dashboard?
Visualization is important because it turns complex incident data into clear, actionable insight. Tools such as incident escalation heatmaps, dynamic escalation charts, and escalation funnel visualizations reveal risk concentration and escalation flow instantly. This clarity supports faster decisions and more effective coordination in a realtime operations center.
Real-Time Escalation Dashboard as an Operational Advantage
A real-time escalation dashboard is an operational advantage. It enforces accountability, protects response times, and prevents small incidents from becoming major failures. This principle applies beyond IT, it’s critical for brand intelligence too.
At BrandJet, we monitor your reputation across human conversations and AI model outputs in real time, because brand crises escalate just as fast as technical ones. See how it works. Start with BrandJet.
References
- https://www.fbiic.gov/public/2012/mar/2011IBMReport-March2012.pdf
- https://nvlpubs.nist.gov/nistpubs/SpecialPublications/NIST.SP.1800-27.pdf
Related Articles

More posts

Prevent Internal Misinformation in Organizations
Prevent internal misinformation by establishing clear communication protocols, verification processes, and a culture...

Internal Crisis Communication: How Teams Stay Aligned
Internal crisis communication is the process organizations use to share clear, accurate information with employees...
Influencer Crisis Detection for Modern Brands
An influencer crisis can cost you trust and revenue. It’s about spotting the danger signs before they blow up. The...