
Table of Contents
A spam reporting dashboard setup is the technical process of connecting your email service providers to a visual interface that tracks spam complaints, bounce rates, and other deliverability metrics in real time. It involves configuring webhooks, selecting key performance indicators, and building a central view so you can stop guessing and start fixing your sender reputation.
Without it, you are operating on hope, not data, and that is a sure way to land in the spam folder. Keep reading to learn the exact workflows that turn chaotic complaint data into a clear action plan.
Key Takeaway
- A proper dashboard setup connects real-time data from your email platforms to visual widgets, moving you from reactive problem-solving to proactive reputation management.
- The core of the system is configuring webhooks from services like SendGrid or Mailgun to feed spam complaint events into your reporting tool or database.
- Effective dashboards focus on a few critical metrics: spam complaint rate trends, top offending subject lines, and a comparison of sends versus complaints over time.
Why Real-Time Spam Monitoring is Essential

The problem with spam is not just that it annoys people, though it certainly does that. The real issue is what happens after the report is filed. That complaint, a simple click from a frustrated recipient, travels back through the complex pathways of the internet to the inbox provider. It becomes a data point in an algorithm that decides your trustworthiness [1].
Without a window into that process, you are sending messages into a void, unaware of the silent judgments piling up against your domain. A spam reporting dashboard is that window. It is the difference between hearing a faint alarm in the distance and watching the fire spread on a security monitor.
You have probably seen the basic stats in your email platform. A number here, a percentage there. But those are isolated facts, not a connected story. A dedicated dashboard pulls those fragments together. It shows the relationship between the email you sent on Tuesday and the spike in complaints on Wednesday.
It highlights the subject line that seemed clever in the meeting but performed terribly in the wild. This is not about more data, it is about the right data, presented so you can understand it at a glance. The goal is to stop the next problem before it starts, and that requires a system.
Summary of Dashboard Setup Methods
| Method | Best For | Key Tools |
| Anti-Spam Portals | Domain-level security | SpamExperts, SpamTitan |
| Custom ESP Dashboards | Marketing campaign ROI | SendGrid, Mailgun, Tableau |
| Security Workbooks | Enterprise threat hunting | Microsoft Sentinel |
Setting Up Your Foundation: The Two Paths Forward

Your approach depends on your primary goal. Are you an administrator securing a company domain, or a marketer focused on campaign performance? The tools you choose, and the first steps you take, will differ.
If your priority is domain-level security and filtering, an anti-spam portal dashboard is the most direct route. These platforms act as gatekeepers at the infrastructure level, and setup happens entirely within the admin interface.
The typical process looks like this:
- Log in to the portal and open the reporting section.
- Choose from pre-built report templates.
- Define the data you want to track, such as:
- Sender IP addresses
- Subject line keywords
- Message disposition (quarantined, delivered, blocked)
- Schedule automated reports, like a daily Email Scout Report sent at a fixed time.
This approach creates a clean, contained system for monitoring what enters and exits your domain. It’s efficient, predictable, and designed to watch the gates.
For marketing and outreach teams, the path is more flexible and more data-rich. This is the Custom ESP Dashboard route. Instead of relying on a single portal, you build a visualization layer on top of raw data from your Email Service Provider (ESP).
The first step here is non-negotiable: enabling webhooks.
To get started:
- Open your ESP settings and activate event notifications.
- Configure the system to send data when key events occur, including:
- Spam complaints
- Email bounces
- Delivery failures
- Define the destination for that data, such as:
- A database you control
- A connector for analytics tools like Looker Studio, Tableau, or DashThis
Initial configuration matters more than it seems. A misdirected webhook means missing data, and missing data creates blind spots in your strategy.
Before moving forward, verify everything works:
- Send a test email.
- Trigger a simulated spam complaint or bounce event.
- Confirm the event appears in your logging or analytics system.
This setup work may feel technical and unglamorous, but it’s foundational. It’s the plumbing behind your dashboard, and like all plumbing, it only gets attention when it fails.
Building the View: What to Put on Your Dashboard
With data flowing in, the next question is what to look at. A cluttered dashboard is as useless as an empty one. You need to prioritize the metrics that tell the most important story about your sender health.
Focus on these three visualizations first:
- Spam Complaint Rate Trend: A simple line graph showing your complaint rate over the last 30, 60, and 90 days. The trend is more important than any single day’s number [2].
- Top Offending Subjects: A table or bar chart listing the email subject lines that generated the highest number of spam reports. This is your content audit guide.
- Sends vs. Complaints: A dual-axis chart that plots your total email volume against your total complaints. It helps you see if problems are scaling with volume or are tied to specific campaigns.
These widgets give you the what. You see a spike in the trend line, you identify the subject from the table that caused it, and you check the volume chart to confirm it was a targeted campaign, not a general issue.
This process turns a vague feeling of “something’s wrong” into a specific, actionable item: “The ‘Last Chance!’ subject line from the Q3 promo caused a 0.2% complaint spike. Retire it.”
But data does not exist in a vacuum. A spam report is a human signal. Someone was annoyed enough to click “report spam” instead of “unsubscribe.” Your dashboard should help you ask why.
Was the email unexpected? Was the offer misleading? Did they forget they signed up? This is where qualitative thinking meets quantitative data. The dashboard highlights the anomaly, and your team’s job is to diagnose the cause.
Advanced Integration: Capturing Direct User Feedback

There is another source of spam data, often overlooked: direct user reports from within email clients like Microsoft Outlook. When an employee clicks “Report Phishing” or “Report Junk” on an internal test email, that is a goldmine of information. It represents human intuition, which can sometimes catch what automated filters miss.
Integrating this feedback requires a bit more technical work. For Outlook, it involves deploying an add-in. You create a manifest file, a piece of code that tells Outlook to add a custom “Report Spam” button to the ribbon. When a user clicks it, an event fires (onSpamReport).
Your backend system needs a listener ready to catch that event, log the details of the reported email, the sender, the subject, the headers, and pipe it directly into your main dashboard database.
This integration creates a powerful feedback loop for spam detection. You can now compare the spam complaints coming from external ISPs (via your ESP webhooks) with the spam reports coming from your own trusted users internally. If your internal team is reporting a certain type of newsletter as spam while the ISPs are not, it is a clear sign your content is missing the mark with an engaged audience.
Conversely, if ISPs are flagging something your team never sees, it might be a list hygiene or acquisition problem. This dual-perspective is what turns a simple monitoring tool into an intelligence system.
From Monitoring to Management: Making Your Dashboard Work
A dashboard is not a “set it and forget it” tool. Instead, it is a living part of your communication workflow guide. To manage your sender reputation effectively, you must actively use the insights it provides.
First, set thresholds and alerts. Most dashboard tools allow you to configure notifications. You should set an alert to trigger if your spam complaint rate exceeds 0.1% (a common industry benchmark for major ISPs).
This alert should not just be an email; it should be a Slack message or a Teams ping that interrupts the workflow of the person responsible. It creates urgency and accountability.
Second, you must act on the data. This is the most crucial step. When the dashboard highlights a problematic subject line or campaign, you need a process to address it. That means:
- Immediately pausing any automated flows using that content.
- Analyzing the audience segment that received it.
- Crafting a follow-up or correction if necessary.
- Documenting the decision so the mistake is not repeated.
Finally, use your dashboard for proactive cleaning. Your spam complaint tracker will often point back to specific segments of your email list, those who have not engaged in over a year, those who signed up under a specific promotion.
Use these insights to run re-engagement campaigns or to suppress inactive segments before your next big send. This turns a defensive tool (monitoring complaints) into an offensive strategy (improving overall list health and engagement).
FAQ
What is a spam reporting dashboard and why do I need one?
A spam reporting dashboard gives one place to see email spam reports, spam abuse reports, and spam complaint logs. It works like a spam monitoring dashboard that shows spam complaint metrics, spam report trends, and spam incident reports.
This helps users quickly understand issues, respond faster, and improve email hygiene using clear spam analytics summaries.
What data should appear in a spam complaint dashboard?
A good spam complaint dashboard includes spam complaint visualization, spam score charts, and spam trend analysis. You should see email spam analytics, spam filter reports, spam quarantine reports, and spam feedback metrics.
Having spam report charts and a spam data visualization panel helps users spot patterns, risks, and sudden spikes without digging through raw logs.
How do spam alerts and notifications work in the dashboard?
Spam alerts come from a spam alert system that triggers real-time updates. A spam alerts dashboard or spam notification panel shows new spam incidents, score changes, and abuse reports. These notifications help users act early by reviewing spam log dashboards, spam incident trackers, and spam complaint summaries before problems escalate.
How do I set up and configure a spam dashboard correctly?
Spam dashboard setup starts with spam report integration from your email spam monitor or spam tracking software. During spam dashboard configuration, choose key spam dashboard metrics, widgets, and charts. A clear spam reporting UI with spam log visualization and spam score monitors ensures users can read data fast and make informed decisions.
How can a spam analytics dashboard improve long-term performance?
A spam analytics dashboard supports smarter decisions through spam report automation and trend tracking. By reviewing spam analytics viewers, spam complaint trends, and spam score dashboards, users can spot recurring issues early.
Over time, spam monitoring tools and feedback dashboards help reduce complaints, improve deliverability, and strengthen trust with recipients.
The Clear Path Forward
A spam reporting dashboard setup is more than a technical configuration. It is the establishment of a feedback loop between your brand and your audience’s inbox. It transforms the opaque, often punitive world of email deliverability into something you can see, understand, and influence.
The process, enabling webhooks, choosing widgets, integrating user feedback, builds a system of accountability. You are no longer hoping for the best. You are watching the metrics that matter, in real time.
The data this system provides is not an end in itself. Instead, it serves as the raw material for better decisions, shaping your content strategy, list hygiene practices, and understanding of audience tolerance.
More importantly, this shift changes your team’s mindset from “did it send?” to “was it received well?” That transition is fundamental.
Email communication evolves from a one-way broadcast into an ongoing conversation, even when the only reply is a spam complaint. At that point, you are no longer guessing, you are listening.
Start with the foundation. Connect one ESP, build one core chart tracking your complaint rate. See the story it tells. Then expand from there. The clarity you gain will protect your domain’s reputation, improve your campaign results, and ensure your message actually reaches the people who want to hear it.
Let BrandJet help you build that clarity. We provide the tools to not only visualize this critical data but to act on it, turning insights into improved deliverability and stronger connections.
References
- https://wpemaillog.com/2025/09/28/how-to-build-a-real-time-email-dashboard-with-logs-status-and-delivery-reports/
- https://dashthis.com/blog/email-marketing-reporting/
Related Articles

More posts

Prevent Internal Misinformation in Organizations
Prevent internal misinformation by establishing clear communication protocols, verification processes, and a culture...

Internal Crisis Communication: How Teams Stay Aligned
Internal crisis communication is the process organizations use to share clear, accurate information with employees...
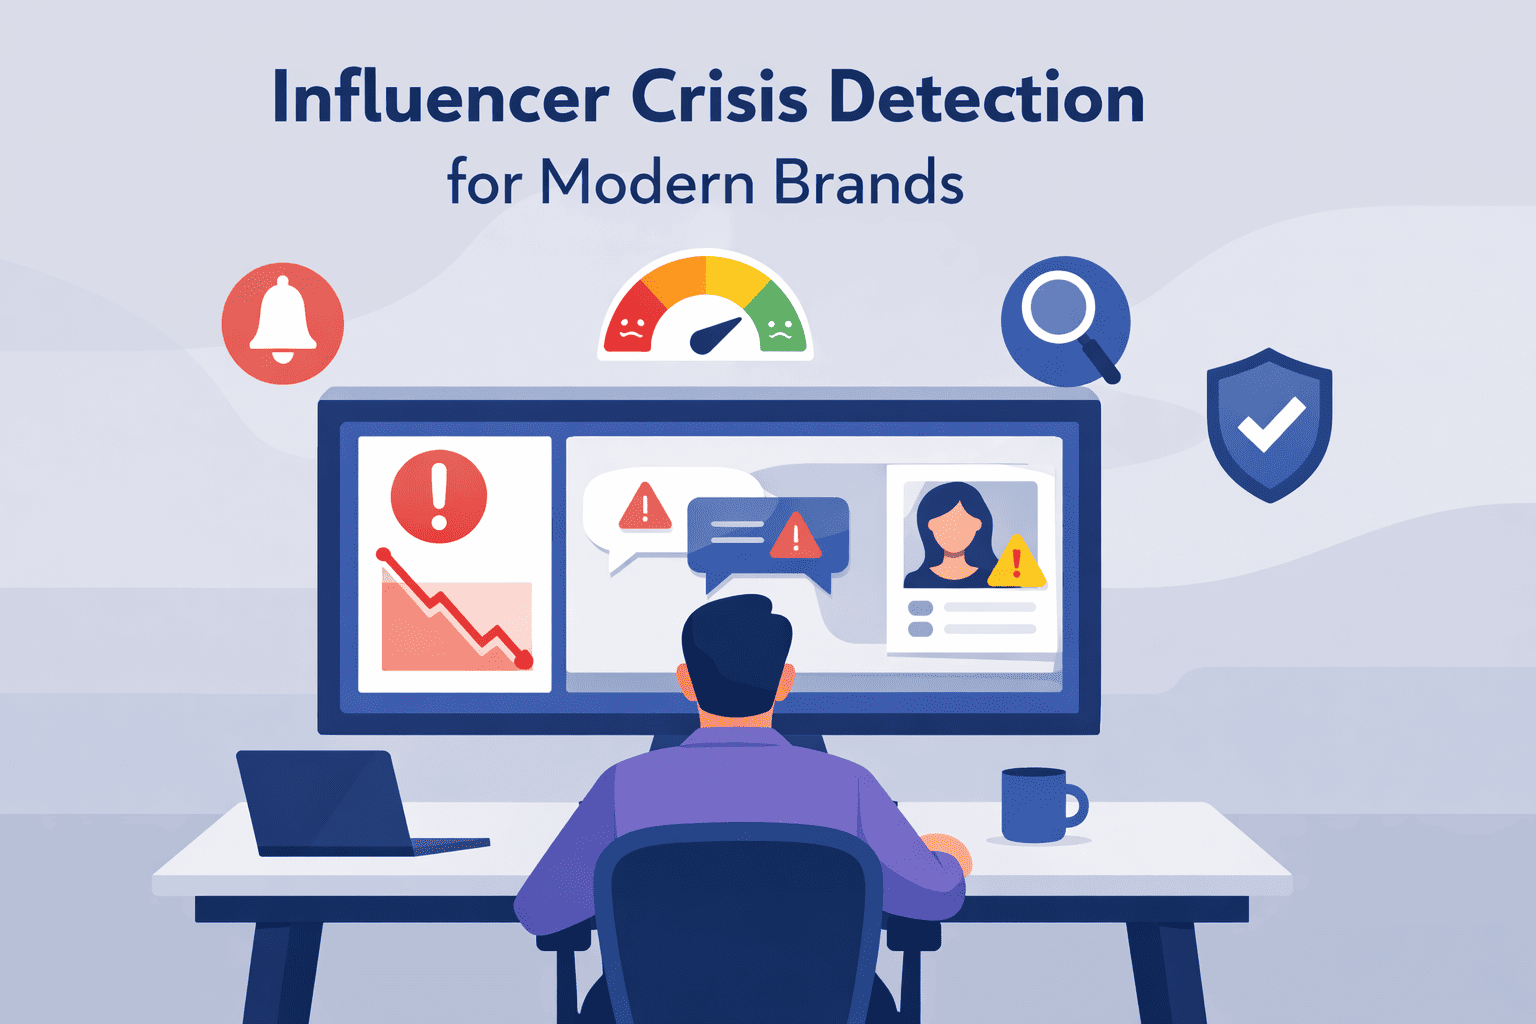
Influencer Crisis Detection for Modern Brands
An influencer crisis can cost you trust and revenue. It’s about spotting the danger signs before they blow up. The...